General description
In 2024, the French Department of Isère created a partnership with the Auvergne-Rhône-Alpes geographic information center (CRAIG) in order to evaluate some roofs’ photovoltaic potential inside their territory.
After publishing a work on modelling roof photovoltaic potential, the CRAIG wished to develop a QGIS plugin that reproduces automatically the processing chain which has been set up as part of the partnership with the French Department of Isère.
Thus, QSunPotential plugin was designed to evaluate the solar potential of roofs by using PVGIS European tools which provide calculation services. PVGIS provides an API to which QSunPotential sends requests and retrieves photovoltaic potential on a point of each roof. PVGIS API gives results at a monthly and annual levels.
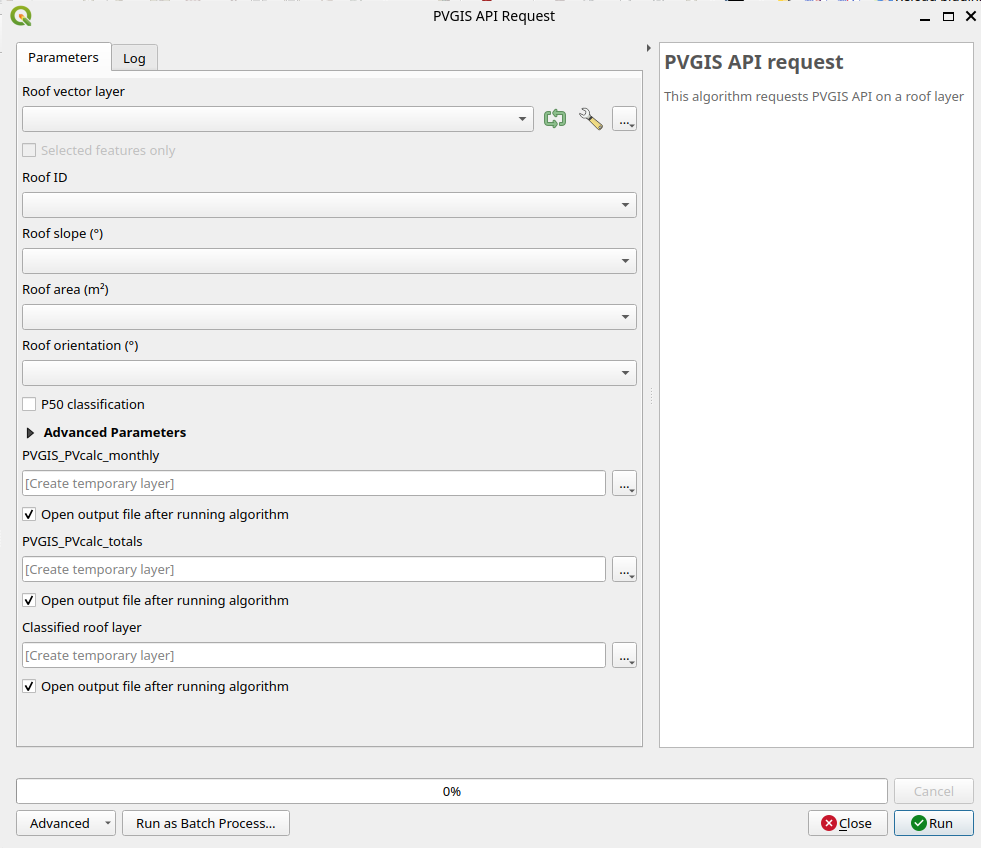
User interface
Input parameters
QSunPotential plugin inputs a roof vector layer that must contain the following fields:
Roof ID;
Roof slope, in degree;
Roof 3D area, i.e. the real surface of the roof, in square meters;
Roof orientation, in degrees, lying between 0 and 360° from North. The plugin will convert it into an orientation to the South, according to the standard used by PVGIS.
Operated processings
The following processing chain is applied to each roof of the input layer:
Check if the geometry is valid (otherwise the roof wil be ignored);
Choose a point inside the roof’s geometry;
Send a request to PVGIS API
Store results in tables
Building PVGIS request
PVGIS gives solar potential on a point on earth, taking into account the following parameters:
angle parameter
It corresponds to the roof’s slope in degrees. As the installation of solar panels on completely plane roofs always includes an inclination between 5 and 10°, it is possible to define a minimal tilt angle and a forced tilt angle in QSunPotential’s advanced parameters.
Important
The default minimal tilt angle is defined at 5° for roofs: the plugin will force a 10° inclination (by default) on roofs inclined below this 5° threshold.
peakpower parameter
The peakpower of a roof is defined by the following formula:
having:
\(S_{roof}\) the roof surface
\(T_{occupation}\) the roof occupation rate
\(coeff\) a multiplier
Important
By default, the plugin sets the following values:
\(T_{occupation}\) = 70%
\(coeff\) = 0.215 kW/m²
Theses values are editable in the UI advanced parameters.
aspect parameter
This parameter corresponds to the orientation (azimuth) of the photovoltaic system. This orientation takes a value between -180 and 180 degrees.
Important
As the roof azimuth is traditionnally expressed between 0 and 360 degrees, the plugin will systematically convert the roof azimuth by substracting 180° from its initial value.
loss parameter
The loss paramater corresponds to the photovoltaic system’s loss rate. It is set to 14% in each request and is not editable in QSunPotential plugin.
Output results
At the end of the processing, the plugin outputs 3 results:
a
PVGIS_PVcalc_totalstablea
PVGIS_PVCalc_monthlytablea classified roof layer
PVGIS_PVcalc_totals
This table contains the average annualized photovoltaic production.
Field name (alias[1]) |
Description |
Unit |
|---|---|---|
gml_surf_id |
Roof ID (join field with the roof layer) |
- |
e_d (E_d) |
average daily energy production |
kWh/day |
e_m (E_m) |
average monthly energy production |
kWh/month |
e_y (E_y) |
average annual energy production |
kW/year |
h_i_d (H(i)_d) |
average daily irradiation per square metre received by the modules |
kWh/m2/day |
h_i_m (H(i)_m) |
average montly irradiation per square metre received by the modules |
kWh/m2/month |
h_i_y (H(i)_y) |
average annual irradiation per square metre received by the modules |
kWh/m2/year |
sd_m (SD_m) |
standard deviation of monthly production due to year-on-year changes |
- |
sd_y (SD_y) |
Standard deviation of annual production due to year-on-year changes |
- |
l_aoi (l_aoi) |
angle of incidence loss |
% |
l_spec (l_spec) |
spectral loss |
% |
l_tg (l_tg) |
temperature and irradiation loss |
% |
l_total (l_total) |
total loss |
% |
p50 (p50) |
output report |
kWh/kW/an |
PVGIS_PVCalc_monthly
Cette table contient la production photovoltaïque pour chaque mois.
Nom du champ (alias) |
Description |
Unité |
|---|---|---|
gml_surf_id |
roof ID (join field with roof layer) |
- |
month |
month number |
- |
e_d (E_d) |
average daily energy production |
kWh/jour |
e_m (E_m) |
average monthly energy production |
kWh/mois |
h_i_d (H(i)_d) |
average daily irradiation per square metre received by the modules |
kWh/m2/day |
h_i_m (H(i)_m) |
average daily irradiation per square metre received by the modules |
kWh/m2/month |
sd_m (SD_m) |
standard deviation of monthly production due to year-on-year changes |
- |
Classified roof layer
The output classified roof layer contains the input selected roofs with annual results join (from PVGIS_PVcalc_totals table).
Classification according to e_y (defaults)
By default, the roof layer is classified according to the average annual energy production e_y.
The roofs are classified into the following classes:
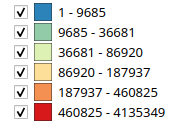
Classification according to the average annual energy production e_y
Classification selon P50
P50 is the output report. It is calculated according to this formula:
The user may choose to classify the roofs according P50. In this case, the roofs are classified into 7 classes:
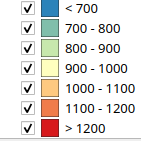
Classification according to P50
Compute performance
The computing time depends on PVGIS API, which imposes a rate limit of 30 calls/second per IP address. Additionnally, processing too many features (roofs) may also lead to a crash of QGIS. At this stage, user tests have shown that the processing outputs successfully for datasets with less than 20 0000 features.